
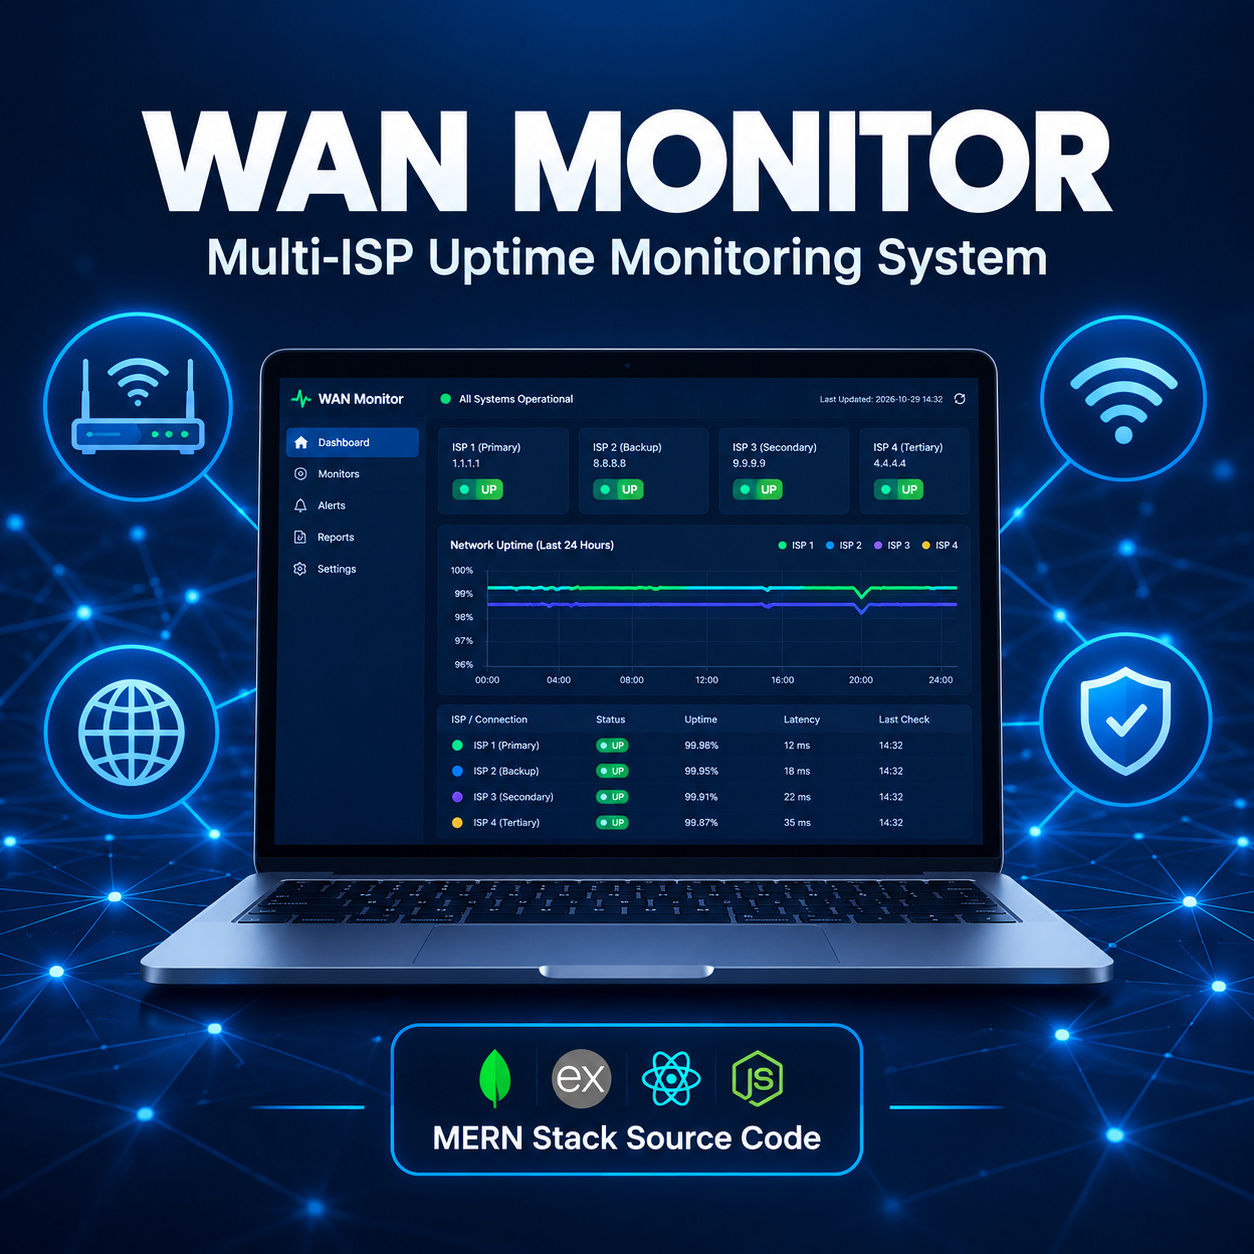
WAN Monitor – Multi-ISP Internet Uptime & Network Monitoring System (MERN Stack Source Code)
Monitor Every ISP Line, Detect Outages, Track Latency & Get Email Alerts
Launch your own WAN / ISP monitoring dashboard with this complete MERN stack source code. Ek Windows agent aapke network ki har internet line ko real-time check karta hai aur dashboard par uptime, latency aur outages dikhata hai. Ye sirf ek ping demo nahi hai, balki ek real, kaam karne wala network monitoring software hai.
Perfect for:
- System integrators and IT service providers monitoring client internet lines
- Offices, schools, factories and shops with multiple ISP / broadband connections
- Starting your own network monitoring / managed IT service business
- Final Year / Major Projects (BCA, MCA, B.Tech, M.Tech)
- Portfolio and resume projects
🚀 Key Features
🌐 Multi-WAN / ISP Monitoring
- Monitor multiple internet connections (ISP lines) from one dashboard
- Probe types: ICMP ping, TCP port, HTTPS and DNS checks
- Multiple health-check targets per connection (for example 8.8.8.8, 1.1.1.1, google.com)
- Quorum setting: a connection is marked DOWN only when enough targets fail, so there are fewer false alarms
- Failure and recovery thresholds to avoid flapping alerts
- Optional gateway IP check, reported separately from ISP status
🖥️ Windows Monitoring Agent
- Lightweight Node.js agent that runs probes from inside your network
- Select a network adapter and source IP for each connection to test a specific ISP line
- Route verification using the Windows routing table, so a probe is never wrongly counted as independent monitoring
- Adapter, IPv4, gateway and DNS diagnostics shown in the dashboard
- Agent heartbeat and offline detection
- PowerShell script to install the agent as an auto-start Windows Scheduled Task
- “Test connection” button to run a live probe before saving a connection
📊 Dashboard, Charts & Reports
- Live status updates using Socket.io
- Latency and packet loss for each connection
- Uptime percentage for 24 hours, 7 days and 30 days
- Probe history with response-time and outage charts (Recharts)
- Incident list with outage start, recovery time and duration
- Uptime report and CSV export of probe data
- Automatic history cleanup (retention is configurable, 180 days by default)
🔔 Alerts & Notifications
- Email alerts for Down, Recovered and Agent Offline events
- Alert preferences for each connection
- SMTP settings from the admin panel, with password stored encrypted
- Test email button
- Notification queue with automatic retry and backoff for failed emails
- Maintenance mode and pause option so planned work does not create false alerts
🔐 Authentication & Security
- JWT admin login with rate limiting on the login route
- Password hashing with bcrypt and admin password change
- Token-protected agent API
- Helmet security headers, CORS origin control and Zod input validation
- Audit log for important actions
- Winston logging
🛠️ Tech Stack
| Layer | Technology |
|---|---|
| Frontend | React 18, Vite, TailwindCSS, Recharts, Lucide Icons |
| Backend | Node.js, Express.js |
| Database | MongoDB + Mongoose |
| Monitoring Agent | Node.js (Windows), PowerShell |
| Authentication | JWT, bcrypt |
| Real-Time | Socket.io |
| Notifications | Nodemailer (SMTP Email) |
| Validation & Logging | Zod, Winston |
| Testing | Node.js built-in test runner |
📦 What You Will Get
- Complete React frontend source code
- Complete Node.js + Express backend API
- Windows monitoring agent source code
- MongoDB models
- Agent auto-start installer script (PowerShell)
- Environment variable template (.env.example)
- Unit and API tests
⚙️ Quick Setup
- Extract the zip file
- Server: copy
server/.env.exampletoserver/.envand add your MongoDB URI, JWT secret, admin email/password and agent token - Run
npm installin the project root, thennpm run devto start the server and dashboard - Agent: configure
agent/.envwith the server URL and the same agent token, then runnpm start(or use the PowerShell script to install it as a startup task) - Login as admin, add your ISP connections and start monitoring
Requirements: Node.js 20+, MongoDB (local or Atlas), Windows PC or server for the agent. SMTP details are optional and only needed for email alerts.
❓ Frequently Asked Questions
Is complete source code included?
Yes, full frontend, backend and agent source code is included.
Can I monitor more than one ISP?
Yes, you can add multiple WAN connections. Each has its own adapter, source IP, check targets, thresholds and alert settings.
Does the agent work on Linux or Mac?
The agent is built mainly for Windows, because adapter and route verification uses Windows commands. Server and dashboard run on any OS that supports Node.js.
Can I use this for my final year project?
Yes, it is ideal for BCA, MCA and B.Tech students.
Do I need any paid service to run it?
No. You only need Node.js and MongoDB. SMTP is optional for email alerts.
Can I customize it?
Yes, you are free to modify and extend it for your own needs.
📩 Need help with setup or customization? Contact us after purchase.




Reviews
There are no reviews yet.